Advanced Symbolic and Numeric Techniques for Machine Vibration Analysis
Dr. Thanh-Son Dao is an application engineer for mathematical and analytical software provider, Maplesoft.
In this article submitted to us from Maplesoft, Application Engineer Dr. Thanh-Son Dao illustrates some of the advantages of using sophisticated lumped mass models combined with experimental measurements for vibration analysis. By applying advanced symbolic and numeric techniques using a tool such as MapleSim, this approach can be used to diagnose and solve a wide variety of vibration issues, including gear box rattling, driveshaft breakdowns, shaft bends, driver's comfort, machine noise, and many others. Overcoming these problems can significantly improve the customer's satisfaction and hence the manufacturer's success.
SEE ALSO: How to Build Models, Analyze With MapleSim
The operational reliability of a rotary equipment train is dependent on the vibration of its components. All rotating machines experience some degree of vibration during all phases of operation: startup, shutdown, and normal continuous operation. Often, the only evidence of this vibration is gear noise or coupling wear. However, these early indicators of vibration might eventually develop into high-amplitude vibration, resulting in gear wear, gear tooth failures, or broken shafts. The torsional response characteristics of rotating and reciprocating equipment should therefore be analyzed and evaluated to ensure system reliability.
In industrial environments, the most common cause of machine breakdowns is bearing failure. This is due to mechanical problems that can affect the bearings but cannot be seen directly, such as unbalance, misalignment, mechanical looseness, bent shafts, resonance, belt problems, gear problems, hydraulic/aerodynamic problems, electrical problems, and others. Among these, the main source for vibration of a driveline system is the engine fluctuating torque. Other vibration sources in the driveline which are important to study are the forced response to the periodic excitation fluctuating torque from the engine, transient response of the driveline to any sudden change of the gear shifting, clutch judder phenomena which may occur during clutch engagement, or natural frequencies of the driveline in order to avoid coincidence of engine torque harmonics. The vibrations of machines are also coupled with other motions of the machine structure like vertical and horizontal motions, or a vehicle might be subjected to frequent stop and start. All of these make the analysis of vibration behavior of mechanical structures complicated and challenging to understand.
In general, there are two approaches to vibration analysis of mechanical structures. The first technique is finite element analysis (FEA) which describes the mechanical structure as a system of thousands of discretized and idealized elementary elements. This results in solving a huge system of thousands of linear equations and therefore remains very time-consuming and expensive. As an alternative, it has become increasingly common to use lumped mass models combined with experimental measurements for vibration analysis. This approach can be expanded to develop more sophisticated models to allow the creation of a highly refined, realistic vibration analysis environment. This article illustrates the latter approach, using the advanced system-level modeling and simulation platform MapleSim, from Maplesoft, as the modeling and analysis tool.
Developing Models for Vibration Analysis
MapleSim gives users the ability to create physical models with any desired level of complexity. There are several ways to develop a model for vibration analysis in MapleSim. The engineer can start with vibration analysis in a one-dimensional setting using the 1D mechanical components. This allows the engineer to build models consisting of springs, dampers, masses/rotational inertias, and force/moment components for either torsional or translational domain while ignoring the other motions to keep the models simple.
Engineers can then use table-lookup components to incorporate experimental data describing characteristics of springs and dampers into the model to describe non-linearity of spring, damper, and shaft components. In order to do this, MapleSim provides a custom component worksheet that calculates spring and damping forces/moments based on an Excel spreadsheet attached to the model. This capability also gives users the freedom to control the component equations to fit their own needs.
Engine Excitation Model
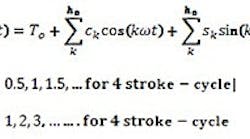
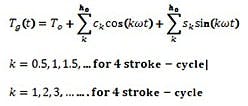
The most predominant cause of vibration in the engine is the gas pressure torque related to the cylinder gas pressure by geometry of the slider-crank mechanism. This gas pressure torque repeats after every complete working cycle. For a four-stroke, single acting engine, the interval of the repetition is two revolutions of the crankshaft (4 ), and for a two-stroke engine, the interval is 2. Due to this harmonic nature, the gas torque is usually represented as a Fourier series as follows:
In engine vibration theory, the number of excitations received during one revolution of the crankshaft is usually called the harmonic order. As an example, the 4th order repeats itself 4 times during each revolution in a two stroke, and 2 times in a four-stroke engine. For a four-stroke engine, the harmonic orders are half multiples (1/2, 1, 3/2). For a two-stroke engine, there are no half-orders and the orders are integer multiples. The harmonic orders and half-orders are represented by the sine and cosine terms in the above gas torque equation.
{pb}
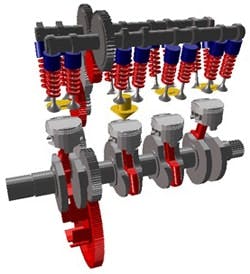
Three-dimensional visualization of a four-cylinder engine in MapleSim.
In details, the gas torque equation consists of a steady part and fluctuating part. This steady part does not excite vibration and is represented as a function of the cylinder firing angle, crank shaft radius, nominal power, and others. The parameter is the maximum number of required harmonic orders; in practice is from 8 to 12. In MapleSim, the user can define the harmonic orders for the engine, including the half-orders for four-stroke engines, through symbolic equations using a custom component or Modelica code. The amplitudes of the sine and cosine terms for each harmonic order in the series can be determined from simulation or experimental data. These amplitudes are entered into a MapleSim model as 2D lookup tables, representing the strength of each harmonic orders over a range of the engine's mean effective pressure.
The gas pressure has to be determined for different speeds and load conditions on an engine test bed using a pressure transducer inside the combustion chamber. The excitation also changes as the rotational shaft varies its speed. This has direct influence on the vibration frequency and therefore machine vibration has to be analyzed over a range of engine RPM's.
The case of a multi-cylinder engine is similar. We assume that all the cylinders have the same outputs, so the gas torque is the same for all cylinders, except that there is a phase difference between the fluctuating torques in the cylinders. Further details about the model are beyond the scope of this article.
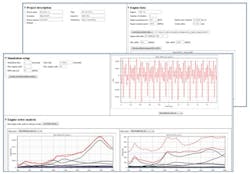
Vibration analysis template.
In MapleSim, the entire vibration analysis can be done using the vibration analysis template shown in Figure 2. MapleSim also allows the user to linearize a non-linear model for control design or modal analysis. For example, the user can extract the dynamic equations in a symbolic form, extract the stiffness and damping matrices, and plot the mode shapes for any driveline models.
Diagram of ship driveline for vibration analysis.
{pb}
Example: Torsional Vibration of Ship Driveline
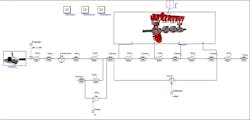
In this section, an example of a simple ship driveline will be used to demonstrate solving torsional vibration problems. The reason a ship driveline is used as an example here is because it has several elements one might encounter in a driveline. The model consists of a four-cylinder, four-stroke internal combustion engine, a propeller which produces the thrust to push the ship forward, and the shaft sections modeled as inertia components with spring stiffness and damping properties. The propeller and the engine are connected through a transmission modeled as a simple reduction gear. There's also a pump at one end of the shaft and a flywheel attached to cylinder 1 which works as a damper for the engine. See Figures 3 and 4.
The two most important sources of vibration in this case are the engine and the propeller. Therefore, models for these components must be described in great detail.
Ship driveline model in MapleSim.
Structurally, the driveline model is relatively simple since there are no translational parts. Therefore, a 1D lumped-mass system is sufficient to build the model. This engine and propeller are subsystems which contain the formulations for the fluctuation torques, which excite the system. For the problem outlined in this section, the cylinder gas excitation torque data generated from real experiments is loaded into MapleSim using 2D lookup tables while the propeller torque is modeled as a second order sinusoidal function which describes the vibration as a function of the number of propeller blades and rotational speed.
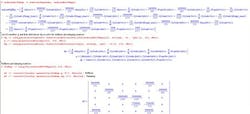
Calculate model stiffness matrix.
Eigenvalue Analysis
MapleSim is built on the foundation of symbolic technology from the Maple mathematical computation engine. This allows the user to extract the dynamic equations for some components or the entire model. Figure 5 shows the use of Maple command lines to extract the differential equations for the entire driveline, then obtain the stiffness matrix which gives the eigenvalues and eigenvectors (or natural frequencies), and mode-shapes for the model. Stiffness and damping coefficient matrices can also be obtained for non-linear systems using the MapleSim Linearization Template.
Contributions of vibration harmonic orders to maximum shear stress between cylinders 1 and 4.
Engine Order Analysis
High levels of vibration occur when the frequency of a peak in the excitation coincides with one of the natural frequencies of the system. Since the excitation frequencies change with engine speed, a wide range of excitation conditions will occur throughout the engine speed range. These vibration-engine speed relationships are not always obvious with standard dynamic signal analysis, particularly with variations in the rotational speed. Therefore, it is crucial to perform engine order analysis to sort out all the many signal components that a rotating machine can generate.
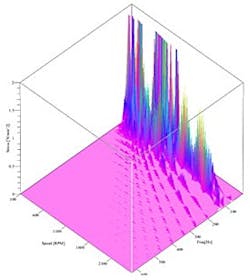
Order spectrum map.
As an example for order analysis in MapleSim, an engine run-up test from 100 to 3000 RPM is performed and the vibration magnitudes for shear stress, vibratory torque, and power loss are plotted for each harmonic order. The first of these is shown in Figure 6. Note that there are 24 orders in the plots since there are both integer and half orders for a four-stroke engine. These plots clearly indicate which orders contribute the most to the overall vibration which is represented as a dotted curve in the plots. For vibration engineers, this information is crucial as it helps engineers focus on the exact components and to measure their contribution to the overall performance of a rotating machine. For example, a vibration engineer can tell which particular gear or driveline component causes the most vibration at a certain RPM. Order analysis is very popular and widely accepted for rotating machinery measurements. Devices ranging from gear motors to gas turbines are tested this way — even dental tools have been designed using order analysis.
Order analysis can also be done using the waterfall diagram as shown in Figure 7. This figure shows the order spectrum map of the measurement. The two horizontal axes are engine RPM and frequency. The Z axis is shear stress between cylinders 1 and 4. The resonance for each order can be examined and at a certain RPM. For instance, orders 1 and 2 appear to be the most interesting, so we can examine these orders and ignore the other orders.

Leaders relevant to this article:
