The Way We Were: Top 100 Innovative Companies in the World
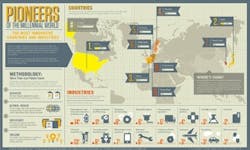
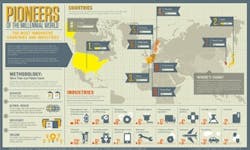
According to the firm, innovation must combine these factors:
- Success, which is defined as the ratio of patent applications to patent grants over the course of the past three years
- Global reach, or the percentage of the patent portfolio recognized and protected by the major patent authorities in the U.S., China, Europe, and Japan
- Influence, which is the long-term impact of inventions, as measured by how often the patent is cited within the industry
- Volume, or the number of new techniques or inventions created—excluding patents that refine existing invention.
Just nine countries included companies in the top 100 at that time. Surprisingly, China fell short. That's because the patents it generated focused on the domestic market, neglecting influence and global reach.
Names like Apple and Boeing put the U.S. on top, with 40% of the companies acing the innovation test. Japan ranked second at 27%, while other countries such as France, Sweden, and—of all places—Liechtenstein ranked at 11%, 6%, and 1%. The Netherlands, Germany, Sweden, South Korea, and Switzerland ranked somewhere between 6% to 3%.
In terms of percent of industries on the list, at 14%, semiconductor and electronic component manufacturing produced the largest number of innovative technologies. Chemical manufacturing came in at 13%. Other industries such as computer hardware landed at 11%, consumer products at 9%, and machinery at 8%.
Stay tuned.... we intend to compare where we were with an analysis of where we are now.
(Besides Thomson Reuters, other sources listed for the infographic included nytimes.com, techcrunch.com, and economist.com)


