A Control Design reader writes: We’ve been kicking around the idea of implementing one remote location for monitoring machine health and production performance in our paper plants, but we’re so overwhelmed with the possibilities that we barely know where to start. The idea of reducing downtime seems like low-hanging fruit, but we aren’t even up to speed on predictive-maintenance practices as yet, so that will involve a culture change across our four facilities. What types of sensors should we be utilizing to gauge machine health? And what about optimizing performance? Is there sensor data we should be tracking and analyzing?
Answers
Predictive maintenance on a budget
In general, there are two separate ways to increase machine productivity—process optimization and downtime reduction. For process optimization on programmable logic controllers (PLCs), most companies take an “if it ain’t broke, don't fix it” approach. I interpret this to mean that the downside risk of breaking something while you’re trying to optimize it exceeds the value of the potential gain. In other words, unintended changes could cause significant damage to a machine and result in extensive, expensive downtime to fix it. This outcome means production losses, too.
Predictive maintenance (PdM) requires a system to use an industrial network like EtherNet/IP or Profibus. One of the original design goals of these networks was to expand the data diagnostic capabilities beyond what Modbus or DH+ provided for predictive-maintenance purposes. The reality is that most machines are built without diagnostics. Diagnostic data needs to be defined, programmed and documented just like I/O, almost always resulting in bigger central processing units (CPUs) and more PLC memory. As a result, implementing diagnostics becomes more than a trivial cost. When reducing a machine’s price, this cost is the first to get cut.
This question originated in a paper plant, which means the plant already has brownfield machines and is asking how to add predictive maintenance. Integrating predictive maintenance into the existing control system would require replacing the whole control system—meaning new I/O, bigger PLCs and then reprogramming the system. From a cost perspective, this course of action is usually not an option.
But the challenge remains: What can be done in a cost-effective way to add predictive maintenance to an existing machine? Assuming this is a running plant with history, to start, I recommend making a list of the most frequent failures the machine experiences, determining how to monitor each failure mode and then monitoring those points with appropriate sensors for changes.
Most machine failures are not instantaneous; they occur gradually over time. For instance, a bearing will run for years within a certain temperature range. In the event of imminent failure, the temperature will rise over the normal historical value. This increase is the ideal trigger for a maintenance event.
By adding sensors to brownfield machines, the values of those sensors can be loaded into the cloud. From there, a supervisory control and data acquisition (SCADA) package can read the values. If you don’t know the values to set alarm points, install the sensors and log data for a few weeks. After you have historical data, you can enter alarm points into the SCADA package based on the collected data. This method will allow you to achieve most of the return on investment (ROI) from predictive maintenance at a fraction of the cost it would take to overhaul the control system. In addition, a key advantage with this approach is that it is entirely separate from the existing control system. If the cloud service is compromised or the monitoring system fails, the machine’s production is not affected.
Philip Marshall
CEO / Hilscher North America
Find the unreliable assets and their failure modes
For those in the paper industry, reliability could be the difference between profit and loss, but knowing where to start is often the challenge. To begin, you need a good grasp of how reliable your assets are and understanding where bottlenecks are. You should look at the most common failure modes and that should drive the type of data you’re collecting from each piece of equipment.
If you do not know your most unreliable assets and their failure modes, then starting with vibration on rotating equipment is always a good bet. By analyzing the data collected from vibration, it can shift you from reactive to predictive maintenance and give you an idea of how machines are performing. Next, look at your machines to ensure that there is a proper lubrication program in place, with the right amounts of lubrication being added to assets at the right time. The third data point that could be valuable is often thermal imaging for your electrical panels. Finally, look at the types of machines you have, classify them by type and then add levels of service to each asset to ensure they’re getting the maintenance that they need. Vibration, thermal and potentially oil analysis for lubrication are the type of sensors you’ll want to use, but criticality rankings will help ensure that you prioritize the right assets.
Once you have a good grasp on reliability, you can then move into optimizing performance. Typically, you’ll already have the sensors you need in place for process control systems, which will aid in optimization; you’ll just need to combine process control with model predictive control. What we’ve seen is that you might already have that data in those sensors, but not looking at the right variables. To further optimize performance, we’d recommend putting in one remote-monitoring location for machine health per plant, instead of one central location for all plants, because even if you have the same asset in multiple plants, the operating conditions in each will have discrepancies. By leveraging technology like edge-computing platforms in each plant, you’ll be able to collect and analyze data to know when machines need to be updated, helping to prevent downtime.
Rudy de Anda
head of strategic alliances / Stratus Technologies
How to choose the right PdM technology
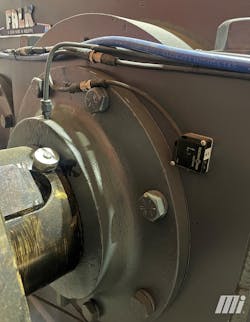
As stated, reducing downtime is the end goal, and achieving improved uptime is where the opportunity lies. Vibration and temperature monitoring are the most widely used PdM tools today with the latest technology. However, lubrication sensors are quickly increasing in popularity, depending on the equipment of importance. If the equipment is critical enough, all three—vibration, temperature and lubrication monitoring—are leveraged for the best uptime results (Figure 1).
There are hundreds of sensors on the market, and all offer value. The first step in technology selection is identifying the characteristics or requirements of a desired solution. This will enable scorecarding each solution on the market. Some of these may include the following.
What technology would you like to start with?
- vibration and temperature
- lubrication
- ultrasound
- thermography
- other technologies
What level of diagnostics is required?
- from overall health only to full diagnostics
What is the preferred method to see the data?
- in-the-plant network
- cloud-based dashboard
- in the plant but off the network (localized solution)
Do all the sensors need to report through one system, or could multiple technologies coexist?
After identifying the list items, create a matrix to quickly view all technology partners, their value side-by-side and their ROI. Partnering with a qualified organization that regularly performs this work will support the journey to predictive maintenance.
Ed Duda
senior manager—P2MRO / Motion
Sensor choices for monitoring machine health
Implementing a remote-monitoring system for machine-health and production performance in your paper plants is a great idea, as it can help reduce downtime, optimize performance and increase efficiency. One way to achieve this is to use technologies such as IO-Link, rotary encoders and vibration sensors. Below are a few of these sensors and technologies that can be deployed.
IO-Link: This technology enables sensors and actuators to be connected to a central control system (ERP/MES/SCADA) via a master using a standard communication protocol. By using IO-Link, you can easily collect data from a wide range of sensors and transmit it to a central control system for analysis and decision-making.
Vibration sensors: These sensors can be used to monitor the vibration of equipment, such as motors, pumps and paper machines. By continuously monitoring the vibration, these sensors can help detect potential failures and prevent downtime. Vibration sensors can also be used to optimize the maintenance schedule, as they can indicate when equipment is due for maintenance or repair.
Rotary encoders: These sensors measure the position and speed of moving parts, such as rollers, gears and motors. In the pulp and paper industry, rotary encoders can be used to measure the speed of the paper machine, the position of the dryer cylinders and the position of the cutting devices in the finishing process. By continuously monitoring the position and speed of moving parts, rotary encoders can help optimize the process and reduce waste.
Temperature sensors: These sensors can be used to monitor the temperature of various processes, such as the cooking process in pulp production or the drying process in paper production. By continuously monitoring the temperature, these sensors can help optimize the process and reduce energy consumption.
Pressure sensors: These sensors can be used to monitor the pressure in various processes, such as the pressure of steam in the cooking process or the pressure in the paper machine. By continuously monitoring the pressure, these sensors can help optimize the process and reduce energy consumption.
Flow sensors: These sensors can be used to measure the flow rate of liquids or gases in various processes, such as the flow of water in the pulp and paper process or the flow of steam in the drying process. By continuously monitoring the flow rate, these sensors can help optimize the process and reduce energy consumption.
Level sensors: These sensors can be used to measure the level of liquids or solids in various tanks or vessels, such as the level of pulp in a storage tank or the level of chemicals in a mixing tank. By continuously monitoring the level, these sensors can help optimize the process and reduce waste.
By using these sensors and technologies and integrating them into a comprehensive remote-monitoring system, you can track and analyze sensor data to optimize performance and reduce downtime. You may also want to consider implementing predictive maintenance practices, as this can help you proactively address potential issues before they lead to downtime. While implementing a culture change across your four facilities may be a challenge, the benefits of predictive maintenance are worth the effort. The data collected from these sensors can be used by various employees within your organization, including production personnel, maintenance, engineering, raw materials stores and purchasing and management. Each of these groups can use the data to achieve specific goals, such as increasing throughput, reducing downtime, improving processes, streamlining the ordering process or analyzing company performance. By using these sensors and technologies and collecting and analyzing this data, you can improve efficiency and make informed decisions to drive the success of your paper plants.
Jason Bean
IIoT market specialist—North America / Pepperl+Fuchs
Sensor platform and setup
As with most instances where adopting a new technology is being considered, it’s always best to start by contacting a knowledgeable manufacturer and get its recommendation for the intended use such as monitoring machine health from a centralized location. There are different platforms of sensors that incorporate IO-Link technology and can be used for remote condition monitoring and tracking other critical performance data. Remote access via IO-Link-enabled devices connected to an IO-Link master allows users to track performance and change settings from any location to optimize plant production. The IO-Link master can then transmit real-time data to a higher-level control system for further analysis. This enables the user to monitor important parameters like sensor and machine health.
Data from proximity, pressure and flow sensors, for example, can be monitored and then adapted to the specific needs of your application. With IO-Link, you can perform tasks like monitor cycle times, set temperature alarms and setpoints remotely. As a result, the installation of IO-Link sensors helps reduce costs in new and existing applications. Additionally, each adjustable switching distance can be run sequentially in combination. The functions of the two outputs can be set independently of one another—positive, negative, positive (PNP); negative, positive, negative (NPN); normally open (NO) contact; and normally closed (NC) contact. The switching distance and hysteresis can be set individually, and the adjustable switching distance can be set separately for each output, allowing one sensor to replace two other sensors. The integrated temperature measuring provides users with diagnostic features for both the sensor and application area around the sensor. User-defined temperature limits can be configured within the physical and technical minimum/maximum temperature and can be output as alerts in the event of limit overruns. These alerts help prevent possible faults in cooling systems or impending temperature damage to the system. The ability to configure two separate switching points allows the IO-Link sensor to replace two conventional sensors for monitoring different positions. For example, only one IO-Link sensor would be needed to indicate an open/closed state when used for wear monitoring.
John Murphy
senior product manager / Turck
Trending flow over time alerts to failures
Pressure and flow are the key performance indicators (KPIs) of machine health. Trending pressure over time can alert you to this common scenario: Imagine that a machine’s control panel has an alert that the timing is off. The operator notices that there is a lag getting one of the cylinders moving and that the cylinder’s rod seems “loose” or “wobbly.” She raises the machine’s operating pressure, which does seem to solve the problem.
This is, of course, a temporary solution. The root cause should be investigated and corrected before the cylinder fails completely. In most factories, there is no mechanism to record unauthorized pressure adjustments, and the situation worsens until the machine breaks down. If pressure had been recorded and analyzed, the time and date of the pressure increase could have triggered an alert so that the problem could have been diagnosed, parts could have been ordered and the repair completed before catastrophic failure occurred.
As a bonus, there is an energy-saving component to tracking pressure. In the scenario above, it is often the case that the pressure never gets restored to its correct value. Since pressure and flow trend together, it is likely that what should have been a temporary pressure increase will cause the machine to forever consume significantly more air than it really needs.
Trending flow over time can also alert you to impending failures. At its most basic level, the flow rate when the machine is idle can be a good indicator of the overall health of the machine. For example, a new machine would typically have a flow rate when idle that is close to zero liters per minute, subtracting any continuous users of air necessary to machine operation. When that flow rate increases, it is typically due to components leaking from physical damage or general wear. Most pneumatic-system failures can be predicted by the leakage rate.
In the scenario described above, the cylinder in question began leaking past its rod seal long before it got “wobbly.” It is also likely that cylinders remain pressurized when retracted, so increased flow would typically indicate a problem. Of course, the flow rate when idle does not tell us specifically which component or components are beginning to wear, just that it is happening.
Taking this a step further can get you to condition-based maintenance. If you can trend the flow rate while the machine is running, it is possible to predict the failure well in advance. For example, if you are tracking the flow rate continuously, you can map those data points against the machine’s motion profile. If we know that cylinder #3 completes the retract stroke 10 seconds into the machine’s normal cycle, an increase in the flow rate at that timestamp would indicate that the rod seal is the culprit since that is the item subject to wear. With a little history, you could predict the time to failure and order the replacement cylinder well in advance.
All of this presumes that you have the capacity to gather this data and transmit it to a system that can analyze it and provide useful, actionable information. At the sensor level, the current trend is to use IO-Link-compatible pressure and flow sensors. The good news is that there are products on the market which can gather this sensor data from multiple machines, transmit it wirelessly to a single hub and provide the data in an open protocol for analysis. This precludes the need to revise the machine’s existing programming, making for a low-risk installation. If you do not have the data-analytics capability in-house, there are third-party vendors who can manage this data for you.
This does sound complicated, but, since the data does not need to run through a machine’s existing control system, the physical installation can be done quickly. The machine or machines can be back up and running while the data-analytics part of the equation is being worked out. Ideally, you would set your goals first and then begin the process of generating the required data, starting with your most critical machine. You might find value in additional data, such as vibration from rotating machinery or the dewpoint of the compressed air and can plan accordingly. You can also take it in steps, starting with the baseline pressures and flows when the machine is idle, as described above, and adding sophistication as you progress.
Jon Jensen
industry projects manager—energy / SMC of America

